Spectrograms of the mind
What Two Years of Journaling Taught Me About Myself
While I was still unpacking my belongs in my beachfront apartment, I wondered how many times I had journaled about this. I searched my journal for the word “beach.” Hundreds of hits popped up. Coincidence? Maybe. But my inner scientist couldn’t resist the thought: what if my journal wasn’t just feelings on paper — what if it was useful data?
The Dataset
For two years, every day, I wrote 5-20 entries across three categories: Brags, Gratitudes, and Desires. Nothing fancy. Just something I do every morning with my coffee and a little spa music.
But even with the simplest analysis, patterns started emerging. My cat shows up constantly (she would be offended if she didn’t). Coffee hums along at a steady baseline. Lasagna? Five mentions, all deeply heartfelt. NCIS? Twenty-eight. Don’t ask. Actually, do ask — Gibbs just has range.
It looks less like therapy and more like a spectrum analyzer tuned to me.
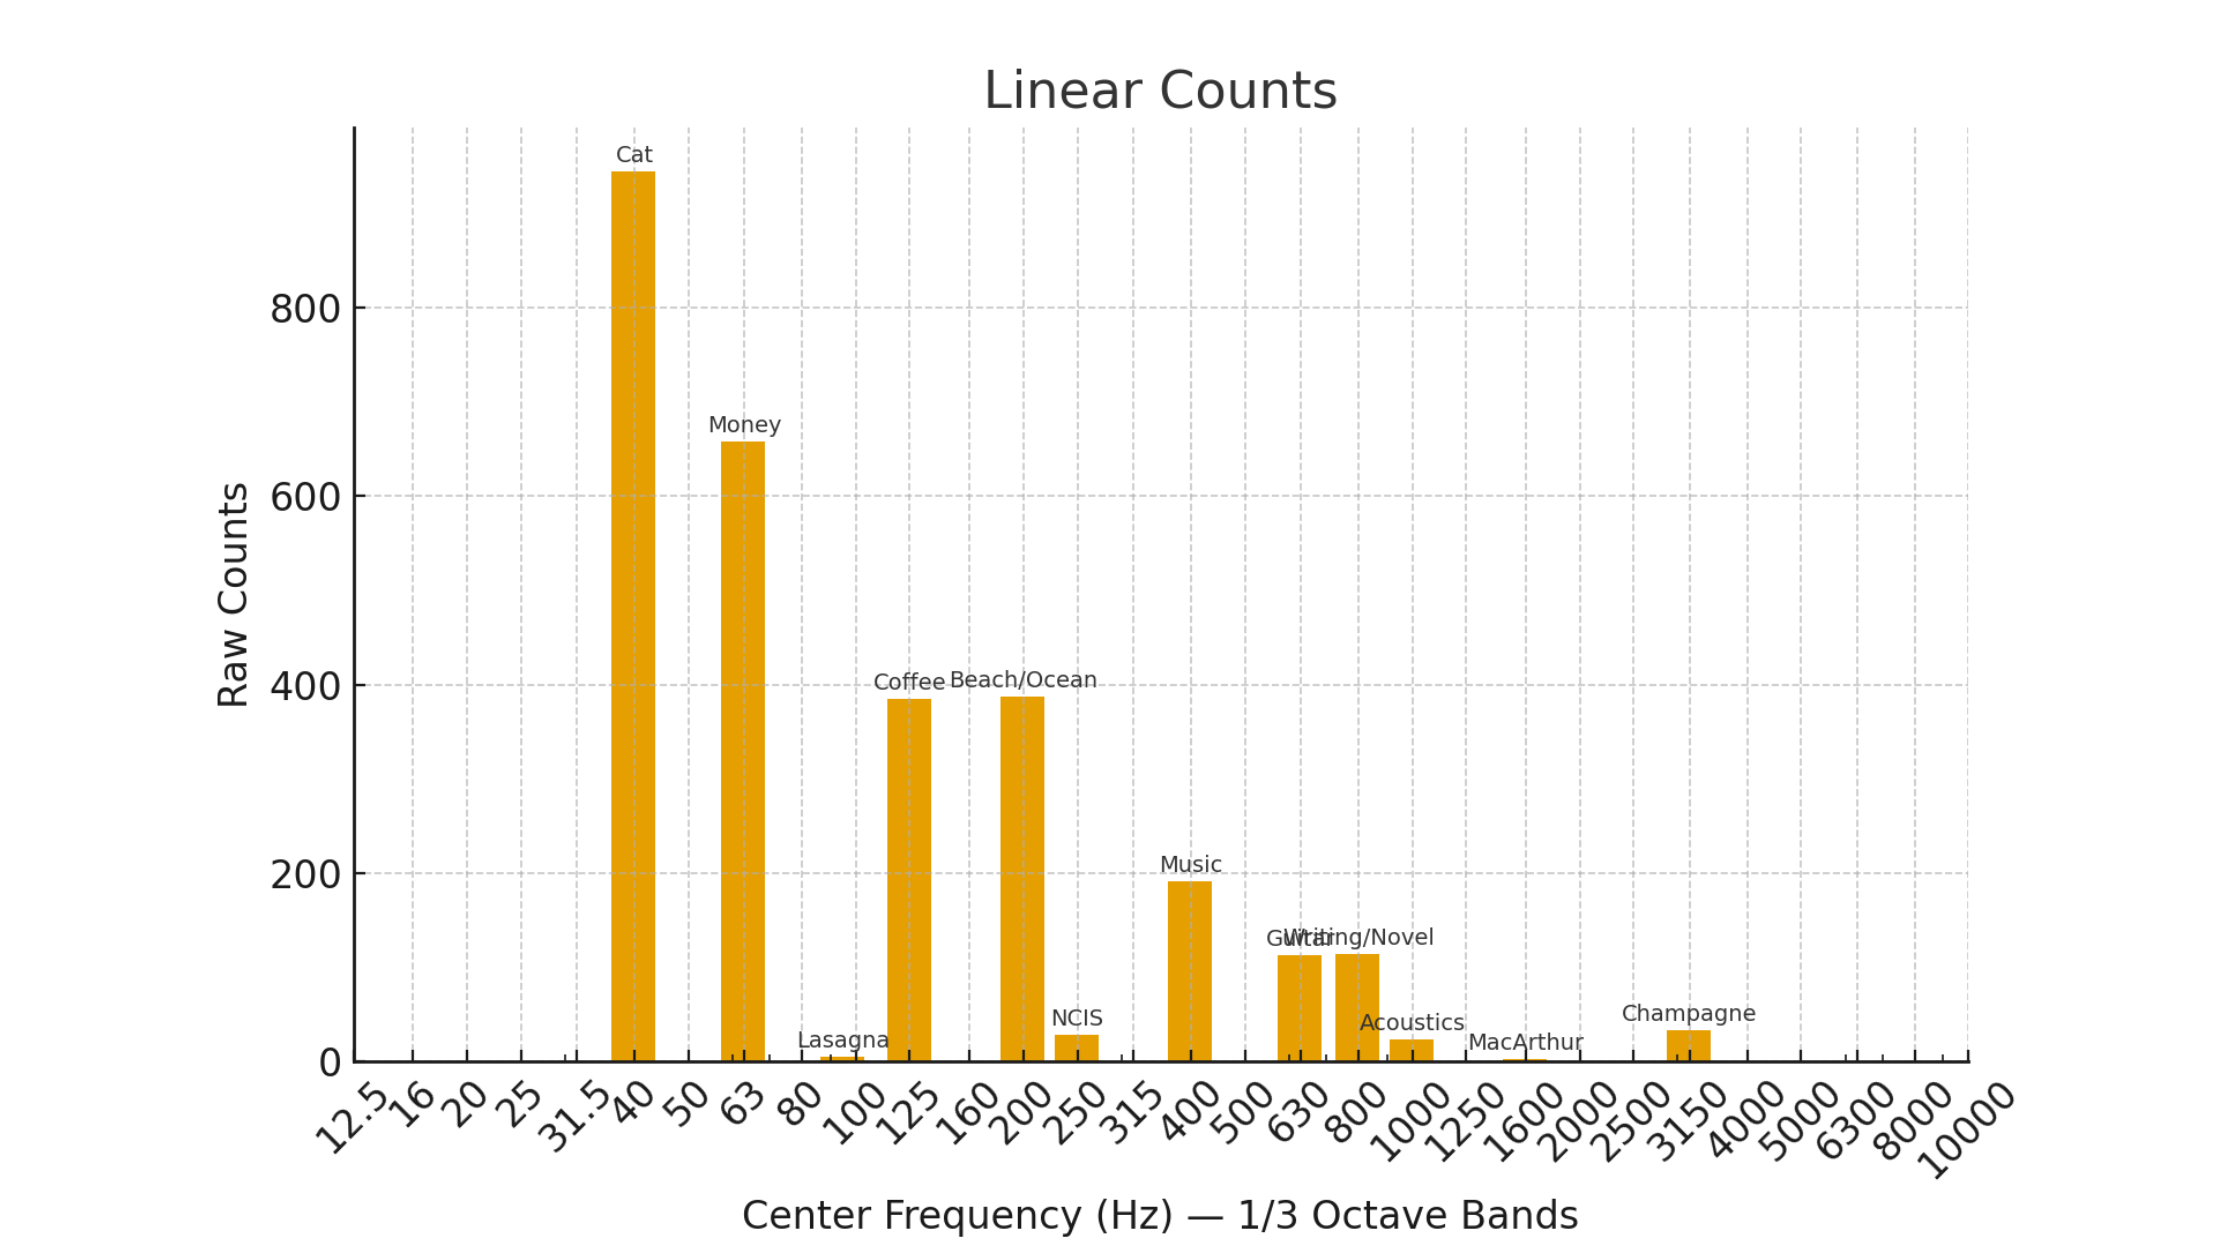
Graph #1: Linear Counts
Raw counts: where Cat looks like it’s eating the world, Money comes in second, and Lasagna politely waves from the basement.
The Analysis (Scientific Rigor Silliness)
Naturally, I had to nerd it up:
Word counts became frequency responses.
Peaks got expressed in decibels. (Cats clocked in at 59 dB, which honestly feels low.)
Obsessions clustered into 1/3-octave bands: food band, pop culture band, creative cluster.
Coffee consumption? Picture a waterfall plot that just… never decays.
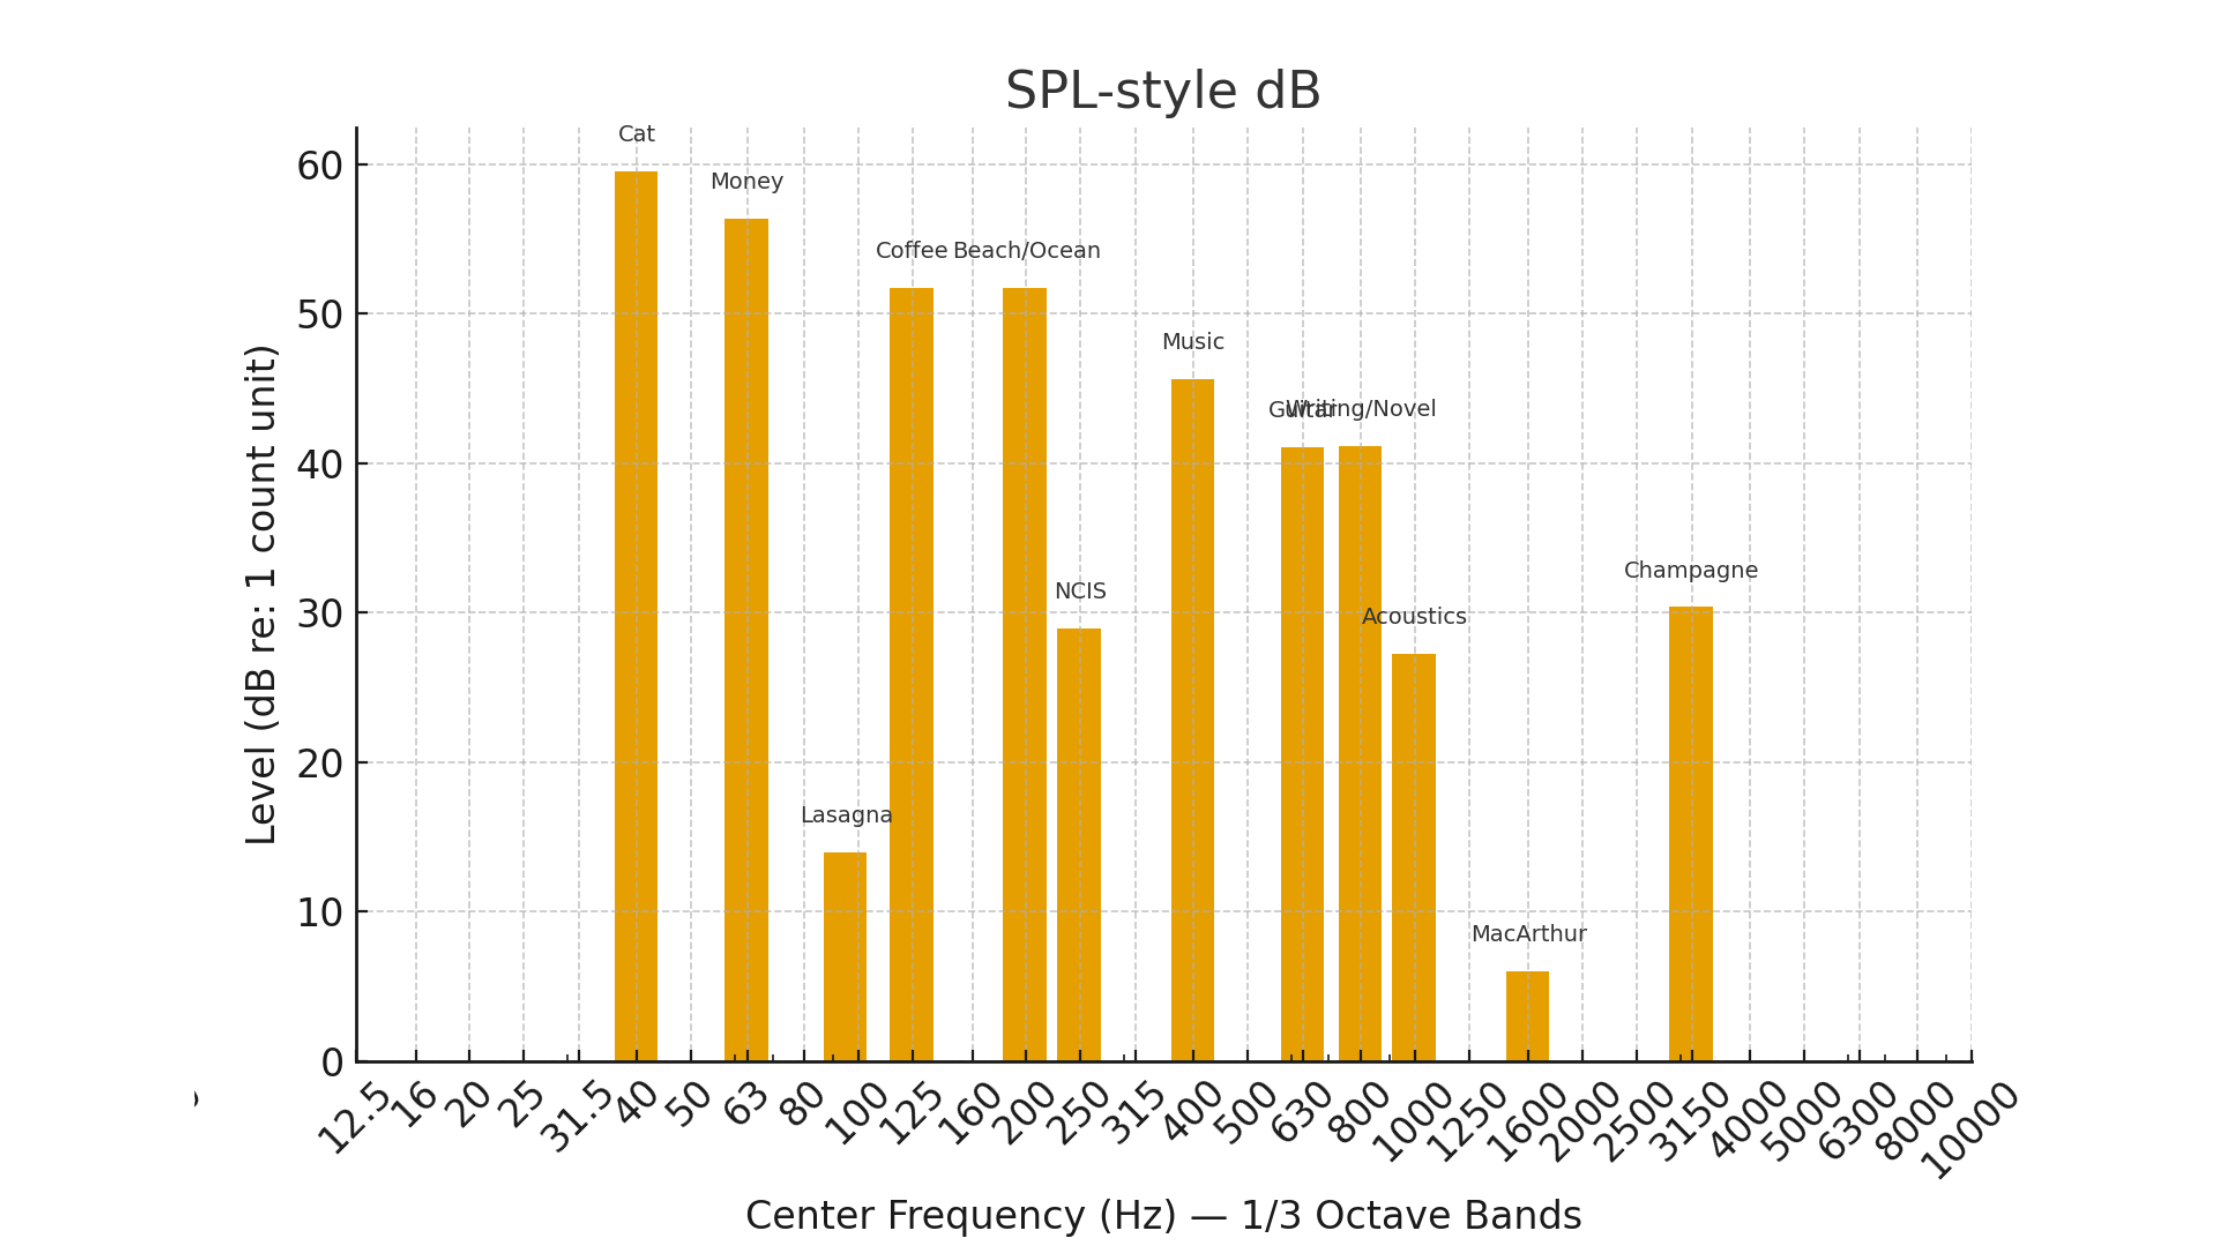
Graph #2: SPL-Style dB
dB view: Cat still wins, but only by 3 dB. Lasagna? Completely inaudible. This is why acousticians don’t live in linear land — we’d go deaf from cats.
Why Does Cat Only Sound 3 dB Louder than Money?
In linear world, Cat at 945 counts vs. Money at 658 looks like a gulf. But your ear doesn’t work linearly — it hears logarithmically. In dB space, Cat only edges out Money by 3 dB: noticeable, but not earth-shattering. Meanwhile, lasagna is buried 45+ dB down, well below the threshold of attention.
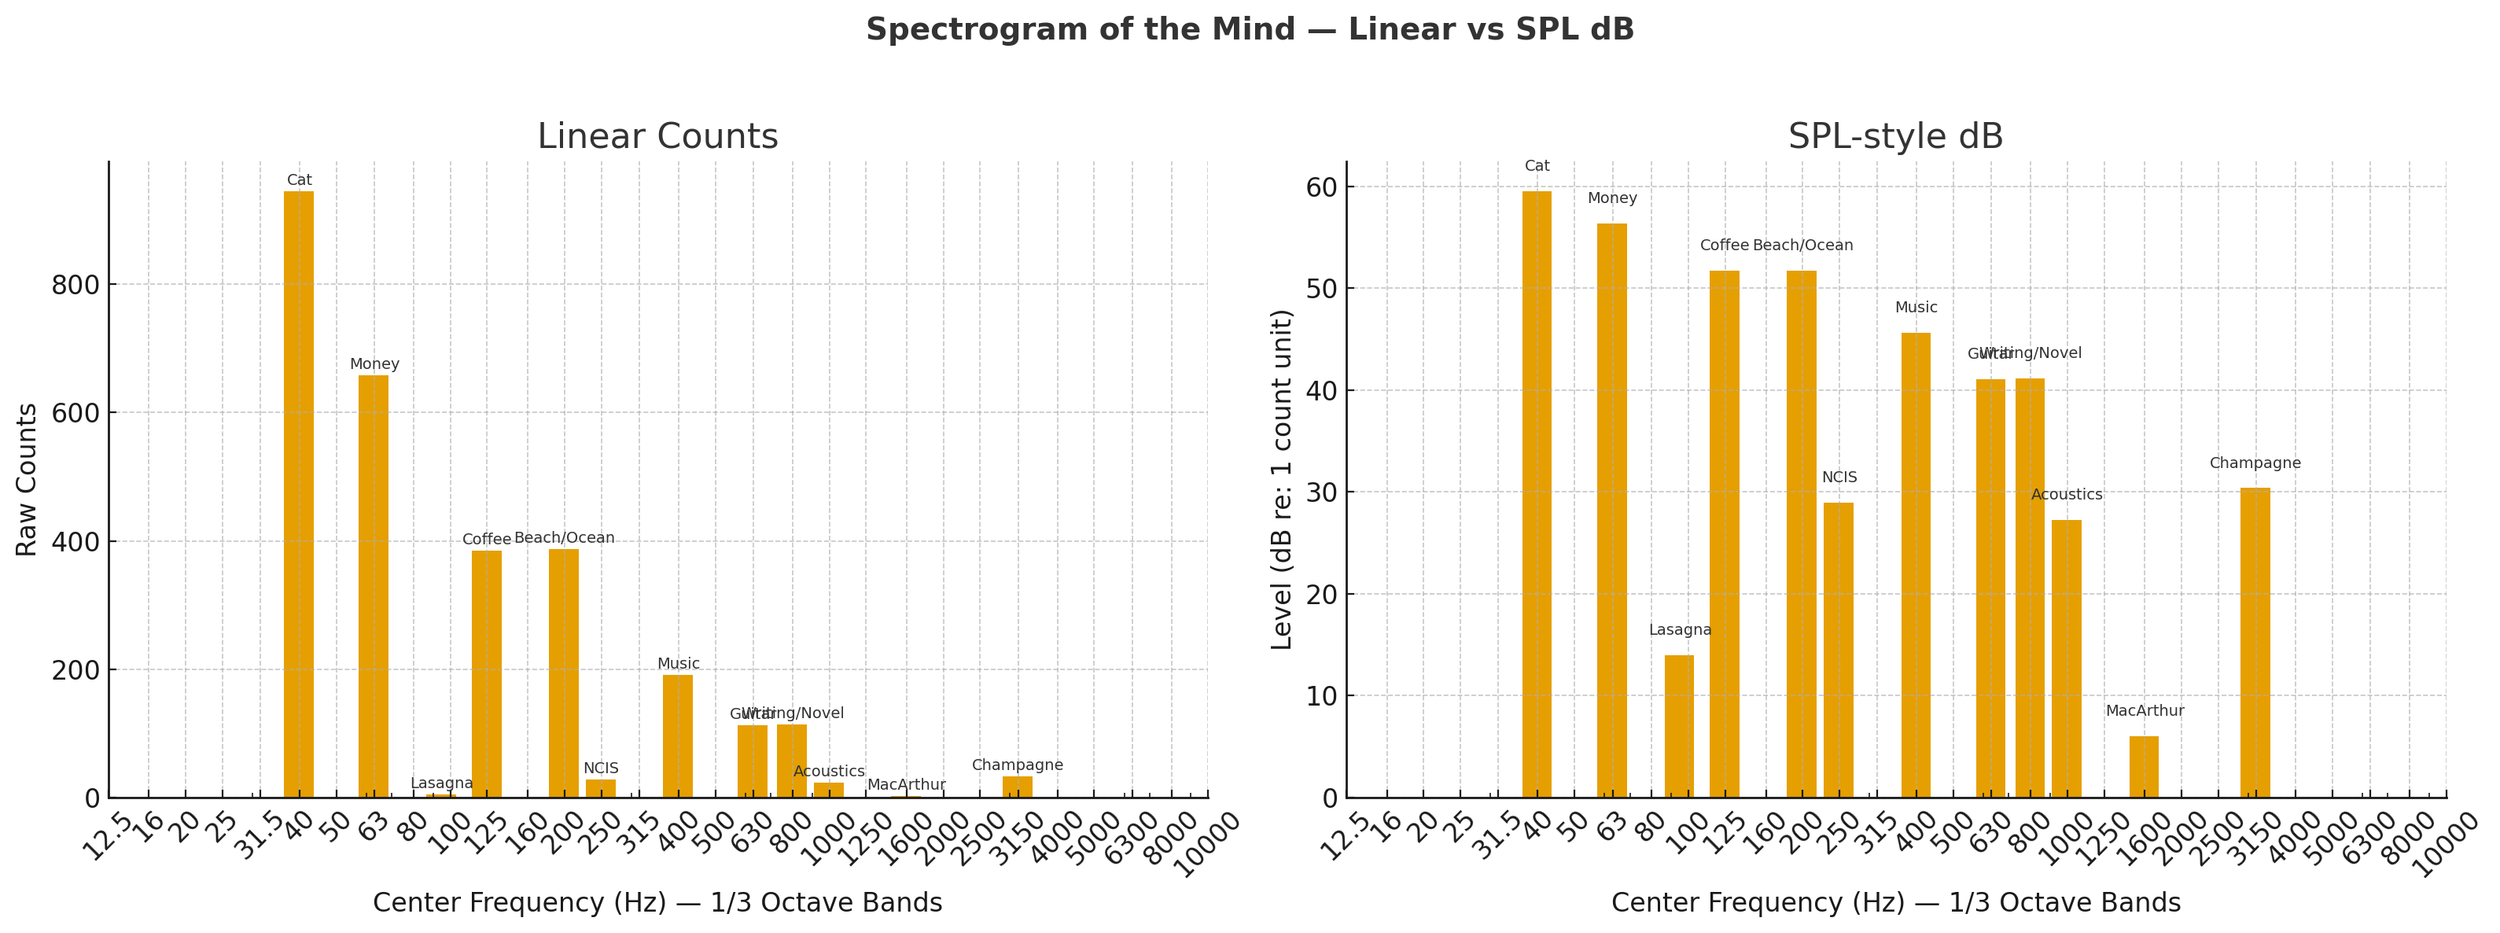
Comparison of Raw Counts vs. dB
This is funny and educational: lasagna disappearing into the noise floor is the same reason acousticians use decibels at all — to compress absurdly wide ranges into something the human brain (and ear) can actually process.
The Humor Layer
Somewhere in there, the puns started breeding: mozzarellative frequencies, impulse responses of bragging, octave bands of obsessions. I swear my journal was auditioning for ANSI standards. If anyone needs a poster on “Impulse Response of the Human Coffee Ritual,” call me.
The Insights
Here’s the wild part: once you dress your diary in a lab coat, actual patterns pop out.
Desires showed up before reality shifts — like the beach thing.
Gratitudes acted like acoustic panels, smoothing the echoes of my day.
Brags traced a growth trajectory — a rising sweep reminding me I’m not stuck.
Turns out the noise in my head has its own harmonics.
Closing Note
You don’t need a wearable or an app dashboard to get insights about yourself. Sometimes a notebook, a nerdy lens, and just enough silliness will do the trick.
So, your turn: if you ran a spectrogram of your life, what frequencies would dominate? And more importantly — how loud would lasagna be?
*This post is a Human-AI Collaboration.